Note
The latest version of this document can be found online at https://dr-knz.net/measuring-errors-vs-exceptions-in-go-and-cpp.html. Alternate formats: Source, PDF.
Introduction
The following document investigates the performance of signalling errors from functions in Go and C++. In contrast with the previous analyses that focused on a single topic, here three separate topics are investigated:
- what is the difference in performance when using the same mechanisms in Go vs C++ (language comparison);
- what is the difference in performance between signaling by returning error values, vs signaling errors via exceptions (mechanism comparison);
- how and when using exceptions for uncommon errors provide better performance than error returns in both C++ and Go.
This is a follow-up to the Go calling convention on x86-64, Measuring argument passing in Go and C++ and Measuring multiple return values in Go and C++.
Note
This document was designed as Jupyter Notebook. The notebook and accompanying data files can be downloaded here.
Mechanisms for signalling errors
There are two common mechanisms to signal uncommon errors in modern programming languages:
- returning multiple values, one of which can be set to indicate an error condition. This is the most common mechanism in Go, and is promoted in Rust via the Result type. In this mechanism, each intermediate caller must check the error value and switch to an alternate control path if an error is detected. The overhead cost of these intermediate checks is paid on every call, even when errors are uncommon.
- returning simple values, and throwing (or raising) an exception to indicate an error condition. The common code path is simple; the language run-time system is responsible for stack unwinding to propagate exceptions to the top level caller where they are handled. This is the most common mechanism in Java, and well-supported by most languages (including Go, where exceptions are called “panics”).
The emphasis in the first point above gives us the working hypothesis for the present analysis: since intermediate error returns incur a price paid even when error do not occur, they must be worse for performance. How much so?
We can predict this will be a trade-off, based on the following observations:
- the intermediate checks on the common case are costly, so “it must be better for performance” to not have them; however
- when using exceptions, the point in the top level caller where exceptions are caught must set up an exception handler, which must happen everytime even if the error case is uncommon. This may be costly too!
So the trade-off is really comparing the cost of the intermediate checks vs. the cost of setting up an exception handler.
We can then further predict what these costs will be.
Predicting the cost of error signalling via error returns
Based on my previous analysis on the Go calling convention, we can make an educated guess as follows:
- in Go, an error result “costs” two words of storage because
erroris an interface type; also, the result values are passed via memory and copied at every intermediate call, so we will see error propagation incur two memory stores to return an error value alongside the main result in leaf functions; two memory loads and a conditional branch to check the error on intermediate calls; plus two additional memory stores on intermediate calls to propagate the error value (or no error) on their return path. - in C++, an error result usually costs just one word, because either it is a simple type or a heap-allocated object and C++ uses simple pointers to refer to them (the vtable pointer, if an abstract base class is used, is stored in the object itself, not its reference). Assuming the main result is a simple value too, both the main result value and the error value can be passed using registers. The overhead is thus one register initialization in the leaf function; plus one register test and conditional branch in the intermediate calls; and one more register initialization on intermediate calls in their return path.
Overall, we can thus expect an overhead twice larger in Go compared to C++, based on the instruction count alone. We will test this hypothesis experimentally.
Of note, the cost of signaling errors via error returns is multipled by the size of the computational work performed; namely, by the number of dynamic calls and returns during the work. It is thus not a fixed overhead. We will come back to this.
Predicting the cost of error signaling via exceptions
In comparison, returning errors via exceptions does not incur the overhead of passing and checking error results in leaf and intermediate functions. So the performance of that part of the work should be identical as when there is no error handling whatsoever.
There are two prices paid for exception handling:
- when setting up the exception handler in the top level function where errors are handled; this must occur every time even when errors do not actually occur;
- when propagating the exception, when errors do occur.
In this analysis, we are focusing on the cost of error handling when errors are rare/uncommon, so we will keep the cost of handling an error that does occur out of scope (and instead keep it as topic for a later analysis). Instead, we will focus on the mandatory costs paid even when errors do not occur.
What is the cost of setting up exception handling?
C++ was designed with the principle of “zero cost abstraction”, where a
programmer must not have to pay (in resource usage or performance) the
price of an abstraction that is not used. This principle is applied to
exception handling: there is no extra work in the generated code to
prepare a function for receiving an exception. When there is no
exception (error), the code behaves as if there was no try/catch
block at all.
Therefore we can expect the overhead of signalling uncommon errors to be truly zero in a C++ program. (We’ll measure that.)
In Go, in contrast, setting up an exception handler requires extra
work.
The exception handler has to run from a deferred call, so the point
where the error is to be handled must pay the price of using defer.
The exception handler uses the built-in function recover(), which
must be called in all cases, even when there is no error. In turn,
internally, this function inspects a data structure in memory (the
goroutine’s status bits) to determine whether an exception is being propagated.
So overall the cost of setting up an exception handler in Go is that of
setting up the defer initially, then on the return path the cost of
iterating over the deferred callback list, a call to the deferred
function containing the call to recover(), and then the cost of
recover() when there is no exception to be caught.
This cost is certainly larger than that of C++, and we will want to measure it below.
Meanwhile, ahead of time, we can also already predict it is constant: it does not depend on the size of the call stack, the size of other return values, the number of calls and returns, the size of the function, etc.
A constant cost will be interesting because it means it can be amortized: there will be cases where there is enough computational work to be done “under” the exception handler that it offsets the fixed overhead. How much work exactly? We will look into it via measurements.
Experimental setup
The source code for the experiments can be found here:
http://github.com/knz/callbench. There are multiple experiment sources
in that repository, today we are focusing on the err experiments:
comparing the cost of signalling errors via error returns and
exceptions, in Go and in C++.
Establishing a baseline
To measure the overhead of each mechanism, we must set up a reference point to use as baseline.
For this purpose we will use the following functions:
//go:noinline
func workNoErr(work int) int {
  var n int
  for i := 0; i < work; i++ {
    // The work parameter controls how much work is performed.
    n += leafNoErr(work + 1)
  }
  return n
}

//go:noinline
func leafNoErr(arg int) int {
  if arg == 0 {
    // Unlikely error case.
    return -1
  }
  // Common non-error case.
  return id(arg)
}

//go:noinline
func id(arg int) int { return arg }
The main function workNoErr takes a parameter work which
controls how much work is to be performed; it is designed so that the
amount of work grows linearly with the value of the parameter.
It calls leafNoErr which represents a “unit of computation”. It
contains an “unlikely” code path which we will later modify to raise an error.
The baseline leafNoArg is not truly a leaf because it in turn calls
the non-inline function id to compute its final result. This is
needed to ensure that leafNoArg contains at least one function call,
and thus forces the compiler to emit a function prologue to set up an
activation record. This is done to ensure a fairer comparison when we
add error handling, where the prologue will also be mandatory.
The various functions are marked with //go:noinline to prevent the
compiler from folding the computation to a constant result.
We then benchmark the code as follows:
func benchNoErr(work int, b *testing.B) {
  val := 1
  for i := 0; i < b.N; i++ {
    val += workNoErr(work)
  }
  CONSUME(b, val)
}
func BenchmarkNoErr1(b *testing.B) { benchNoErr(1, b); }
func BenchmarkNoErr2(b *testing.B) { benchNoErr(2, b); }
/// etc.
We use the final CONSUME function as described in the previous
article,
to prevent the compiler from optimizing the loop away.
The equivalent C++ code is then implemented alongside, also using tricks to prevent compiler optimizations that would reduce the amount of work to nothing.
We then instantiate 17 variants of these benchmarks, with values of
work between 0 and 10 inclusive, and then 20, 50, 100, 200, 500, 1000.
The benchmark kernel uses in Go the standard go test -bench
infrastructure. In C++, it uses the library
cppbench which re-implements the
go test -bench infrastructure in C++, so that we are measuring the
same things in the same way in both languages.
Measuring error returns
The functions we are going to measure are defined as follows.
In Go, we add a standard error return to the baseline function
defined above:
//go:noinline
func leafErr(arg int) (int, error) {
  if arg == 0 {
    // Unlikely error case.
    return 0, errObj
  }
  // Common non-error case.
  return id(arg), nil
}

//go:noinline
func workErr(work int) int {
  var n int
  for i := 0; i < work; i++ {
    val, err := leafErr(work)
    if err != nil {
      return 42
    }
    n += val
  }
  return n
}
This function computes the same result as workNoErr above in the
common case where no error occurs. In fact, the error can never occur in
this specific example, but the Go compiler does not know this. This is
why this function is a good instrument to measure the overhead of error
propagation when errors do not occur.
For the C++ code, we define an abstract error type like in Go with
an instance errObj, and we then implement the equivalent code, again
with tricks to prevent too much cleverness in compiler optimizations. We
use std::tuple to return an error alongside a result value.
As before, we generate 17 variants of these benchmarks, from work size 0 to 10 and then 20, 50, 100, 200, 500, 1000.
Measuring exception signalling for uncommon/rare errors
We are going to use the following functions, which compute the same results as those above but using a different mechanism for error handling:
//go:noinline
func leafExc(arg int) int {
  if arg == 0 {
    // Unlikely error case.
    panic(errObj)
  }
  // Common non-error case.
  return id(arg)
}

//go:noinline
func workExc(work int) (res int) {
  defer func() {
    if r := recover(); r != nil {
      res = 42
    }
  }()
  var n int
  for i := 0; i < work; i++ {
    n += leafExc(work + 1)
  }
  return n
}
The C++ code is implemented likewise, with try/catch and throw
for exceptions.
As before, we generate 17 variants of these benchmarks, from work size 0 to 10 and then 20, 50, 100, 200, 500, 1000.
Running the benchmarks
We run all these 102 benchmarks as follows:
cd go; make err_go.logcd cpp; make err_cpp.log
Then we copy the two log files into the directory of the Jupyter notebook.
The specific measurements illustrated in the rest of this document were obtained in the following environment:
- CPU: AMD Ryzen 7 1800X 3593.33MHz Family=0x17 Model=0x1 Stepping=1
- OS: FreeBSD 12.0-ALPHA2 r338241
- go version 1.10.3 freebsd/amd64
- C++ FreeBSD clang version 6.0.1 (tags/RELEASE_601/final 335540)
Data preparation
We will use the same data preprocessing as the previous articles. Check the corresponding section there for an explanation.
import re
def load(fname, pattern):
    data = [x for x in open(fname).read().split('\n') if re.match(pattern, x) is not None]
    data = [x[9:] for x in data]
    return data

data = ['Go/' + x for x in load('err_go.log', 'Benchmark(Exc|Err|NoErr)')] + \
       ['Cpp/' + x for x in load('err_cpp.log',  'Benchmark(Exc|Err|NoErr)')]
print ("number of results:", len(data))
print ("example result row: %r" % data[0])
number of results: 102
example result row: 'Go/NoErr0    t2000000000t         2.19 ns/op'
import re
r = re.compile('^(\S+)\s+\S+\s+(\S+)\s+.*')
data = [m.groups() for m in [r.match(x) for x in data] if m is not None]
print ("example result row: %r" % (data[0],))
example result row: ('Go/NoErr0', '2.19')
data = [(x[0], float(x[1])) for x in data]
print("example result row: %r" % (data[0],))
example result row: ('Go/NoErr0', 2.19)
def filterdata(pattern):
    r = re.compile(pattern)
    matchvals = [(r.match(x[0]), x[1]) for x in data]
    xvals = [int(i[0].group(1)) for i in matchvals if i[0] is not None]
    yvals = [i[1] for i in matchvals if i[0] is not None]
    return xvals, yvals
xgo, ygo = filterdata('Go/NoErr(\d+)')

# Really the X values are the same for all series.
# We'll use the series letter "e" to denote error-returns,
# and "p" to denote "exceptions".
xvals = xgo
_, yego = filterdata('Go/Err(\d+)')
_, ypgo = filterdata('Go/Exc(\d+)')
_, ycpp = filterdata('Cpp/NoErr(\d+)')
_, yecpp = filterdata('Cpp/Err(\d+)')
_, ypcpp = filterdata('Cpp/Exc(\d+)')
Data analysis
We’ll use matplotlib for plotting. This needs to be initialized first:
%matplotlib inline

import matplotlib
import matplotlib.pyplot as plt
Understanding the baseline
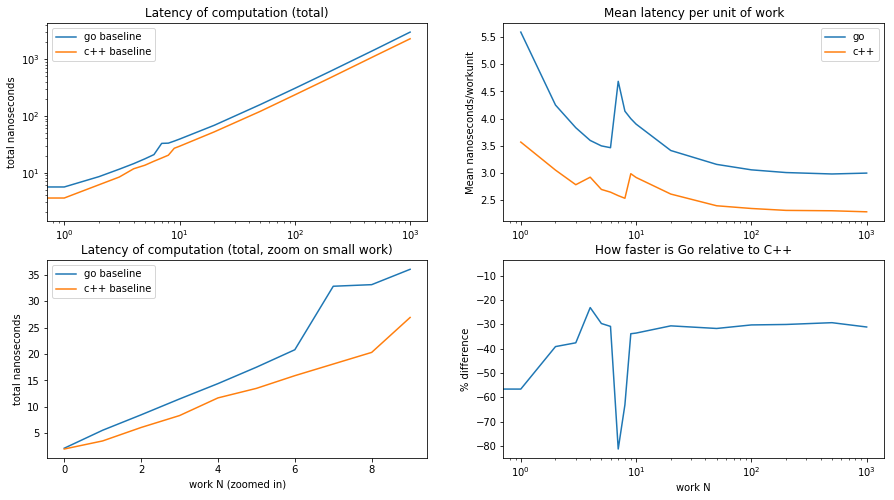
We plot our baseline first, to understand where we’re at. Based on the previous analysis of argument passing and return values, we expect the C++ code to be about a third faster or more, because it uses three times fewer instructions.
plt.figure(figsize=(15, 8))
plt.subplot(2,2,1)
plt.plot(xvals, ygo, label='go baseline')
plt.plot(xvals, ycpp, label='c++ baseline')
plt.title('Latency of computation (total)')
plt.ylabel('total nanoseconds')
plt.xscale('log'); plt.yscale('log')
plt.legend()
plt.subplot(2,2,3)
plt.plot(xvals[:10], ygo[:10], label='go baseline')
plt.plot(xvals[:10], ycpp[:10], label='c++ baseline')
plt.title('Latency of computation (total, zoom on small work)')
plt.ylabel('total nanoseconds')
plt.xlabel('work N (zoomed in)')
plt.legend()
plt.subplot(2,2,2)
plt.plot(xvals[1:], [y/x for (x,y) in zip(xvals[1:],ygo[1:])], label='go')
plt.plot(xvals[1:], [y/x for (x,y) in zip(xvals[1:],ycpp[1:])], label='c++')
plt.title('Mean latency per unit of work')
plt.ylabel('Mean nanoseconds/workunit')
plt.xscale('log')
plt.legend()
plt.subplot(2,2,4)
plt.plot(xvals, [100.*((y2-y1)/y2) for (y1,y2) in zip(ygo,ycpp)])
plt.title('How faster is Go relative to C++')
plt.ylabel('% difference')
plt.xlabel('work N')
plt.xscale('log')
plt.show()
What does this tell us?
As we wanted, the total latency increases linearly with the work parameter.
Also as expected, the Go code is somewhat slower than the equivalent C++
code, about 50% in the “skeleton“ of workNoErr (when leafNoErr
is never called), down to about 30% faster when there is enough work to
amortize the initial overhead of setting up the activation record.
We can also see a phase change at about 6 units of work, most clearly revealed in the top right graph: when that threshold is reached, the latency per unit of work suddenly increases. Given that a similar bump occurs for C++ and Go, it is hard to blame some memory/cache effect (the C++ code uses much less memory than the Go code). It is yet unclear to me what architectural feature causes this bump. I suspect a pessimisation in the branch predictor, but I would not know how to test this hypothesis.
Other than this odd phase change at around 6 units of work, the overall performance behavior is regular and well aligned with the predictions.
A measure of the overhead of error return propagation
Let us look at the measurement of the same function with error returns added.
def baseplots(ysgo, yscpp, lbl):
 plt.figure(figsize=(15, 8))
 plt.subplot(2,2,1)
 plt.plot(xvals, ysgo, label='go '+lbl)
 plt.plot(xvals, yscpp, label='c++ '+lbl)
 plt.title('Latency of computation (total)')
 plt.ylabel('total nanoseconds')
 plt.xscale('log'); plt.yscale('log')
 plt.legend()
 plt.subplot(2,2,3)
 plt.plot(xvals[:10], ysgo[:10], label='go '+lbl)
 plt.plot(xvals[:10], yscpp[:10], label='c++ '+lbl)
 plt.title('Latency of computation (total, zoom on small work)')
 plt.ylabel('total nanoseconds')
 plt.xlabel('work N (zoomed in)')
 plt.legend()
 plt.subplot(2,2,2)
 plt.plot(xvals[1:], [y/x for (x,y) in zip(xvals[1:],ysgo[1:])], label='go '+lbl)
 plt.plot(xvals[1:], [y/x for (x,y) in zip(xvals[1:],yscpp[1:])], label='c++ '+lbl)
 plt.title('Mean latency per unit of work')
 plt.ylabel('Mean nanoseconds/workunit')
 plt.xscale('log')
 plt.legend()
 plt.subplot(2,2,4)
 plt.plot(xvals, [100.*((y2-y1)/y2) for (y1,y2) in zip(ysgo,yscpp)])
 plt.title('How faster is Go relative to C++')
 plt.ylabel('% difference')
 plt.xlabel('work N')
 plt.xscale('log')
 plt.show()

baseplots(yego, yecpp, 'errors')
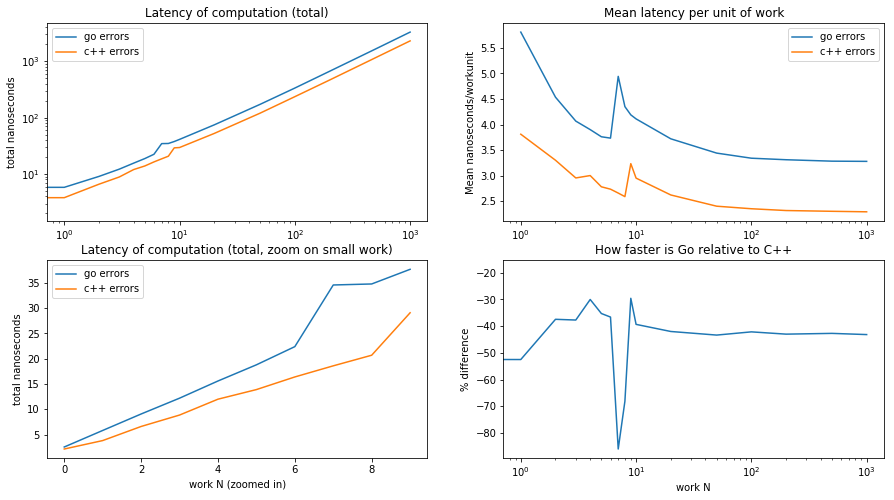
What does this tell us?
The shape of the data is very close to that of the baseline. It is hard to see anything! To provide clarity, we should instead substract the baseline;
def relplots(ysgo, yscpp, lbl):
 ovhgo = [y-ybase for (y,ybase) in zip(ysgo, ygo)]
 ovhcpp = [y-ybase for (y,ybase) in zip(yscpp, ycpp)]

 plt.figure(figsize=(15, 8))
 plt.subplot(2,2,1)
 plt.plot(xvals, ovhgo, label='go errs')
 plt.plot(xvals, ovhcpp, label='c++ errs')
 plt.title('Overhead latency (total)')
 plt.ylabel('Overhead nanoseconds')
 plt.xscale('log'); plt.yscale('log')
 plt.legend()
 plt.subplot(2,2,3)
 plt.plot(xvals[:10], ovhgo[:10], label='go errs')
 plt.plot(xvals[:10], ovhcpp[:10], label='c++ errs')
 plt.title('Overhead latency (total, zoom on small work)')
 plt.ylabel('Overhead nanoseconds')
 plt.xlabel('work N (zoomed in)')
 plt.legend()
 plt.subplot(2,2,2)
 plt.plot(xvals[1:], [o/x for (x,o) in zip(xvals[1:],ovhgo[1:])], label='go errs')
 plt.plot(xvals[1:], [o/x for (x,o) in zip(xvals[1:],ovhcpp[1:])], label='c++ errs')
 plt.title('Mean overhead latency per unit of work')
 plt.ylabel('mean overhead ns/workunit')
 plt.xscale('log')
 plt.legend()
 plt.subplot(2,2,4)
 plt.plot(xvals, [100.*((y1-y2)/y1) for (y1,y2) in zip(ovhgo, ovhcpp)])
 plt.title('How much more overhead in Go relative to C++')
 plt.ylabel('% difference')
 plt.xlabel('work N')
 plt.xscale('log')
 plt.show()

relplots(yego, yecpp, 'errors')
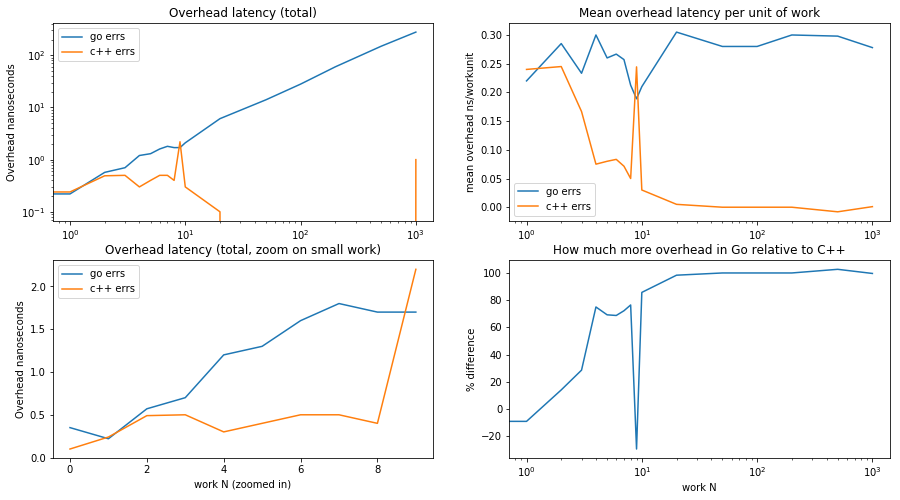
Wowzer, there is some surprising behavior in here.
Perhaps the most simple to understand is the behavior of the Go code. As expected, there is an extra overhead for each unit of work — the cost of error checking and propagation is paid on every return. The two left graphs show the total overhead increase with the size of the workload.
The top right graph shows the average overhead per work unit: between 0.20 and 0.30 nanoseconds, paid by the two extra instructions.
As to the C++ code, the data show something interesting. For small amounts of work (up to about 6 units) there is an overhead per unit of work; beyond that, the overhead becomes negligible — as if there was no extra work performed for error checking!
Meanwhile, of course the machine code executed is the same regardless of work size, so the extra work is actually performed. How come does this not show up in measurements?
We are seeing here an effect of hardware optimizations in the
micro-architecture, which we already saw at work in the original
analysis on argument
passing:
the test of the error return and the conditional increment of the loop
variable var are independent from the work performed in
leafErr, and so the superscalar issue unit in the processor can
schedule the first instructions of the next call of leafErr in
parallel with the instructions to check the error return of the previous
call to leafErr. Although the total amount of work is greater, the
pipelining hides this difference and it shows up in measurements as zero
marginal overhead.
The reason why this optimization does not kick in for the Go code is that it works when the computation uses mostly registers; the Go code is too memory-heavy for the hardware issue unit to detect the potential data concurrency.
The final bottom right graph confirms the initial hypothesis that the overhead of error checking/propagation in Go is at least twice larger as that of C++.
Finally, another way to look at the overhead is to compute it as a percentage cost over the baseline compute latency:
def prelplots(ysgo, yscpp, lbl):
 ygorelbase = [100.*((y-ybase)/ybase) for (y,ybase) in zip(ysgo, ygo)]
 ycpprelbase = [100.*((y-ybase)/ybase) for (y,ybase) in zip(yscpp, ycpp)]

 plt.figure(figsize=(15, 8))
 plt.subplot(2,2,1)
 plt.plot(xvals, ygorelbase, label='go '+lbl+' %ovh')
 plt.plot(xvals, ycpprelbase, label='c++ '+lbl+' %ovh')
 plt.title('Overhead relative to baseline')
 plt.ylabel('Overhead %')
 plt.xscale('log');
 plt.legend()
 plt.subplot(2,2,3)
 plt.plot(xvals[:10], ygorelbase[:10], label='go '+lbl+' %ovh')
 plt.plot(xvals[:10], ycpprelbase[:10], label='c++ '+lbl+' %ovh')
 plt.title('Overhead relative to baseline (zoom on small work)')
 plt.ylabel('Overhead %')
 plt.xlabel('work N (zoomed in)')
 plt.legend()
 plt.subplot(2,2,2)
 plt.plot(xvals[1:], [y/x for (x,y) in zip(xvals[1:], ygorelbase[1:])], label='go '+lbl+' %ovh')
 plt.plot(xvals[1:], [y/x for (x,y) in zip(xvals[1:], ycpprelbase[1:])], label='c++ '+lbl+' %ovh')
 plt.title('Mean overhead relative to baseline per unit of work')
 plt.ylabel('mean % overhead/workunit')
 plt.xscale('log');
 plt.legend()
 plt.show()

prelplots(yego, yecpp, 'errs')
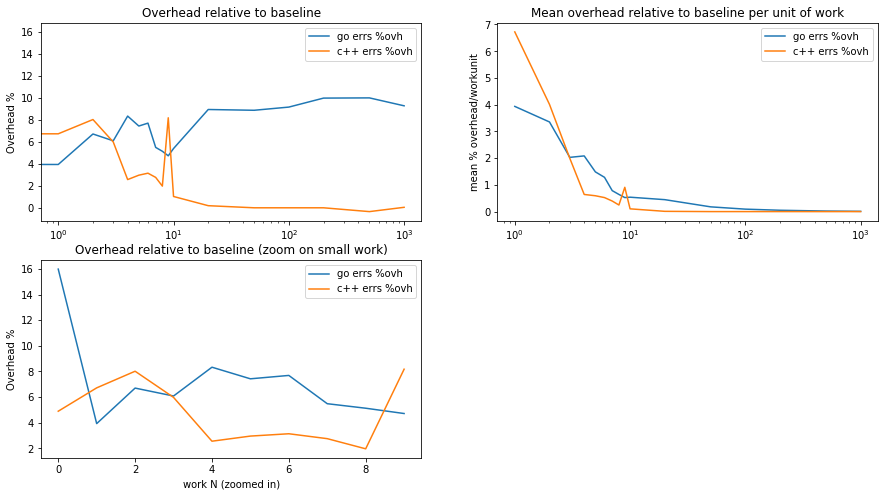
As a percentage of the baseline, the C++ code incurs a larger overhead than Go for small work sizes (but the baseline is sufficiently small that the absolute latency result is still lower than Go’s).
As the work size increases, Go’s relative overhead becomes greater, which combined with the larger baseline latency is rather unfortunate.
A measure of the fixed cost of error signalling via exceptions
The other mechanism we are studying in this analysis uses exceptions (“panics” in Go) to signal errors.
To summarize the experimental set-up, we are using functions that are written to prepare for the eventuality of error (i.e. set up an exception handler) but never actually signal an error (because errors are “uncommon”).
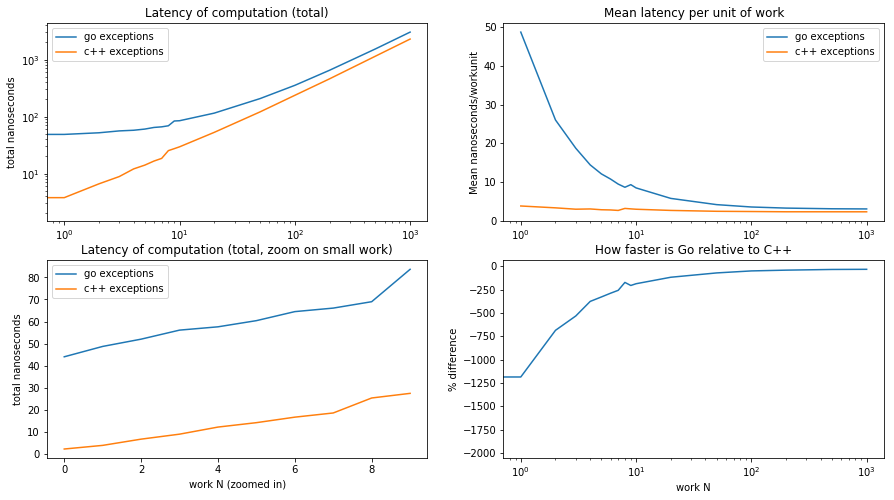
Here is the measured latency for the same parameters as above:
baseplots(ypgo, ypcpp, 'exceptions')
What does this tell us?
Fully as expected, C++ has no overhead for setting up an exception handler, whereas the Go code pays about 45 nanoseconds upfront. This price is constant regardless of the work size, so is amortized as the work size grows.
The bottom right graph confirms that the initial overhead in Go can be amortized: for small work sizes the relative performance hit compared to C++ is huge, but as the work size grows the difference is reduced (and converges, if we zoom in on the y-axis for larger work sizes, to the 40% perf difference between the two languages observed with the baseline).
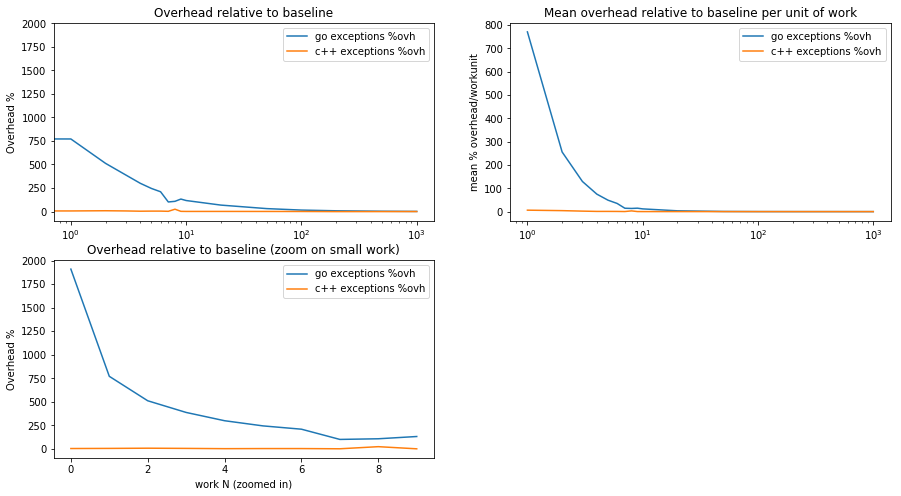
To clarify this data further, we can focus on the overhead by substracting the baseline latency, and looking at this difference as a percentage of the baseline latency:
prelplots(ypgo, ypcpp, 'exceptions')
What does this tell us?
Again, fully as expected, C++ incurs no overhead on the individual work units.
The overhead in Go is constant and independent of work size. It can thus be amortized: it decreases as a percentage of the baseline latency when the work size grows.
Comparing mechanisms
Let us now compare the mechanisms to each other.
plt.figure(figsize=(15, 8))
plt.subplot(2,2,1)
plt.plot(xvals, ygo, label='go baseline')
plt.plot(xvals, yego, label='go error returns')
plt.plot(xvals, ypgo, label='go panics')
plt.title('Latency of computation (total)')
plt.ylabel('total nanoseconds')
plt.legend()
plt.subplot(2,2,3)
plt.plot(xvals[:10], ygo[:10], label='go baseline')
plt.plot(xvals[:10], yego[:10], label='go error returns')
plt.plot(xvals[:10], ypgo[:10], label='go panics')
plt.title('Latency of computation (total, zoom on small work)')
plt.ylabel('total nanoseconds')
plt.xlabel('work N (zoomed in)')
plt.legend()
plt.subplot(2,2,2)
plt.plot(xvals, ycpp, label='c++ baseline')
plt.plot(xvals, yecpp, label='c++ error returns')
plt.plot(xvals, ypcpp, label='c++ exceptions')
plt.title('Latency of computation (total)')
plt.ylabel('total nanoseconds')
plt.legend()
plt.subplot(2,2,4)
plt.plot(xvals[:10], ycpp[:10], label='c++ baseline')
plt.plot(xvals[:10], yecpp[:10], label='c++ error returns')
plt.plot(xvals[:10], ypcpp[:10], label='c++ exceptions')
plt.title('Latency of computation (total, zoomed in)')
plt.ylabel('total nanoseconds')
plt.xlabel('work N (zoomed in)')
plt.legend()
plt.show()
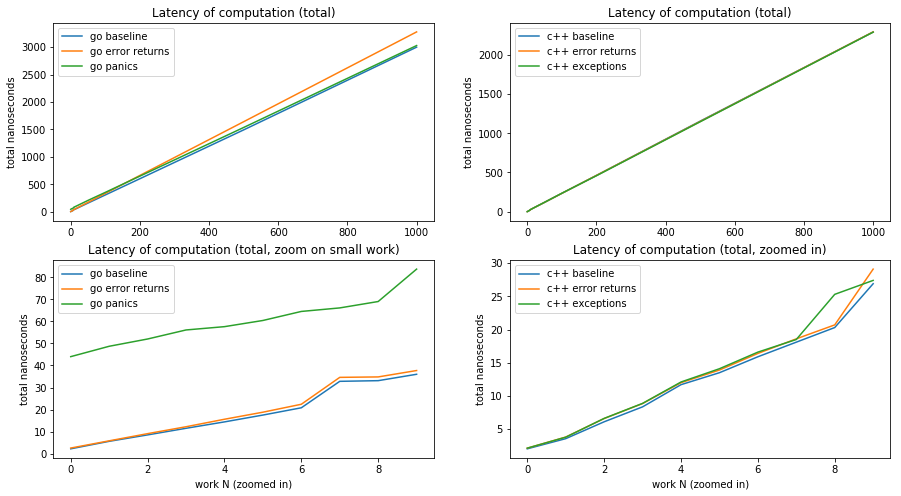
The data is pretty unambiguous:
- in C++, which mechanism is used in C++ to signal does not impact latency meaningfully. When looking closely, error returns are objectively more expensive (more instructions executed) than using exception handling, but micro-architectural optimizations can hide this difference.
- in Go, there is a fixed overhead of at least 40 nanoseconds for setting up an exception handler; however
- when the work “under the error handling” is large enough, signaling using exceptions (when they are uncommon/rare) is more efficient and yields clearly lower latencies.
We can zoom into the graph to find the inflection point:
plt.figure(figsize=(15, 4))
plt.plot(xvals[13:15], ygo[13:15], label='go baseline')
plt.plot(xvals[13:15], yego[13:15], label='go error returns')
plt.plot(xvals[13:15], ypgo[13:15], label='go panics')
plt.title('Latency of computation (total, inflection point)')
plt.ylabel('total nanoseconds')
plt.xlabel('work N (zoomed in)')
plt.legend()
plt.show()

That is, using exceptions to signal errors “pays off” performance-wise when there is about 500 nanoseconds worth of work “under” the point exceptions are handled.
Reminder/disclaimer: this result is measured in the context of the test program we are studying. The inflection point may lie at a different work size in your own code. Run your own experiments.
Summary and conclusions
The particular way the Go compiler generates code makes error signalling via return values incur a non-negligible performance overhead — between 4% and 10% in our tests — compared to code which only returns its main results.
This price is mostly incurred by Go’s usage of memory to pass return values (a choice unlikely to be revisited any time soon, as per the discussion on a proposal to change it).
When using exceptions instead to signal errors (“panics” in Go), this overhead is eliminated from the computation code in the common case when errors do not occur. However! The fixed cost to set up an exception handler in go, even when exceptions are uncommon/rare, goes upwards of dozens of nanoseconds. Therefore, exception handling in Go is only advantageous performance-wise relative to error returns when there is enough work “under” the error handler to offset this fixed cost.
(In comparison, C++ code generators commonly apply the “zero cost
abstraction” principle and ensure that exceptions do not cost anything
unless they actually occur — so adding a try/catch block does not
reduce performance in any way.)
A fixed cost of dozens of nanoseconds (~45ns on this test system) is no small change compared to “simple” computations. However, in real world code, a software component may launch many computations on behalf of a single API call, and that API entry point can catch errors for all of them. For example, a SQL database needs only capture and report one error for the entire execution of a query, and SQL queries often cost milliseconds to execute; in that case, exception handling would be unequivocally better for performance than error return checking/propagation.
The empirical record for Go “best software practices” for error signalling when errors are rare/uncommon thus evolves as follows:
| Use case | Error returns | Exceptions (“panics” in Go) | ||
|---|---|---|---|---|
| Tutorial-level examples with little relevance to the real world | Pros |
|
Pros |
|
| Cons |
|
Cons |
|
|
| Lightweight or one-shot computations but with non-trivial implementation | Pros |
|
Pros |
|
| Cons |
|
Cons |
|
|
| Performance-sensitive code, where short latencies and/or high throughput matter | Pros |
|
Pros |
|
| Cons |
|
Cons |
|
|
Note
There is a proposal floating around to introduce syntactic sugar to ease the writing and reading of error return checking/propagation in Go 2.
While this may improve the readability and maintainability of the code, it has no bearing on performance: even with this proposal, under the hood, errors are still returned and checked/propagated on every intermediate call.
So even/if that proposal gets implemented, exceptions still be the better choice for performance.
Further reading
Also in the series: